Leave Your Message

Machinery Noise Diagnosis

"It's louder than it used to be" tells you something changed. FFT analysis tells you what — breaking a machine's noise into its frequency components reveals the specific signature of a worn bearing, a bad gear mesh, or a failing motor.

View Recommended Instrument

An Overall Level Tells You "Louder." A Spectrum Tells You Why.

A single dB(A) reading is a useful early warning — it tells you a machine has gotten louder than its baseline. What it can't tell you is which component is responsible. A worn bearing, a misaligned coupling, a damaged gear tooth and a failing motor winding can all raise the overall level by a similar amount while sounding nothing alike to an experienced ear — and completely different under frequency analysis.

FFT (Fast Fourier Transform) analysis breaks the machine's total noise into its individual frequency components. Specific fault types leave specific signatures: bearing defects generate energy at characteristic frequencies tied to the bearing's geometry, gear problems show up at the gear mesh frequency and its harmonics, and electrical faults in a motor often appear as a tone at twice the line frequency.

Acoustic diagnosis complements vibration-based condition monitoring particularly well when a component is hard to reach with a contact sensor, or when the concern is airborne noise itself rather than structural vibration.
1800
Dynamic range covered without manual range switching, capturing both a quiet baseline and a loud fault event
10Hz–20 kHz
Frequency range covered — from low-order rotational signatures up through high-frequency bearing and gear-mesh content


                                               Three Ways FFT Analysis Earns Its Keep

                                                                                                   From a quick spot-check to a long-term trend that catches a fault developing slowly.

  • Bearing & Gear Fault Signatures


    Non-contact acoustic scanning picks up the high-frequency content that early-stage bearing and gear-mesh defects generate, often before a general vibration check flags anything unusual.
    1
  • Motor & Electrical Noise Diagnosis


    A tone at twice the line frequency often points to an electrical or magnetic issue inside a motor, distinguishable from purely mechanical noise sources once the spectrum is examined.
    2
  • Long-Term Trend Logging


    24-hour monitoring with large onboard storage tracks how a critical machine's spectrum evolves over days or weeks, catching a slowly developing fault well ahead of a general-purpose spot-check.
    3
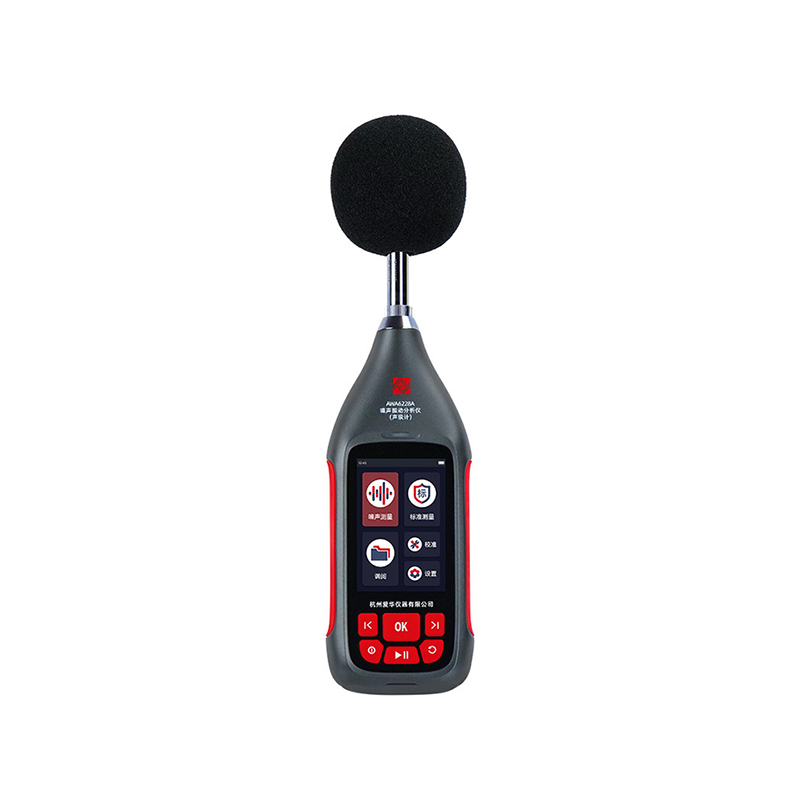
AWA6228A Noise and Vibration Analyzer
AWA6228A Noise and Vibration Analyzer

✓  DSP-based, Class 1 accuracy — complies with IEC 61672-1:2013 Class 1, IEC 61260-1:2014 Class 1, and IEC 61252:2025.

✓ Full spectral toolkit — total noise, statistics, 24-hour monitoring, 1/1 & 1/3 octave analysis, FFT and sound exposure in one instrument.

✓ 126 dB dynamic range — no manual range switching needed between a quiet baseline and a loud fault event.

✓ 64 GB onboard storage, expandable, with millisecond-level data logging for long-term trend records.

✓ 4G / WiFi / Bluetooth / USB connectivity, 3.5-inch touchscreen, and an optional on-site micro printer.

View details
about us
T​​​​hree Decades Building the Reference Standards Themselves
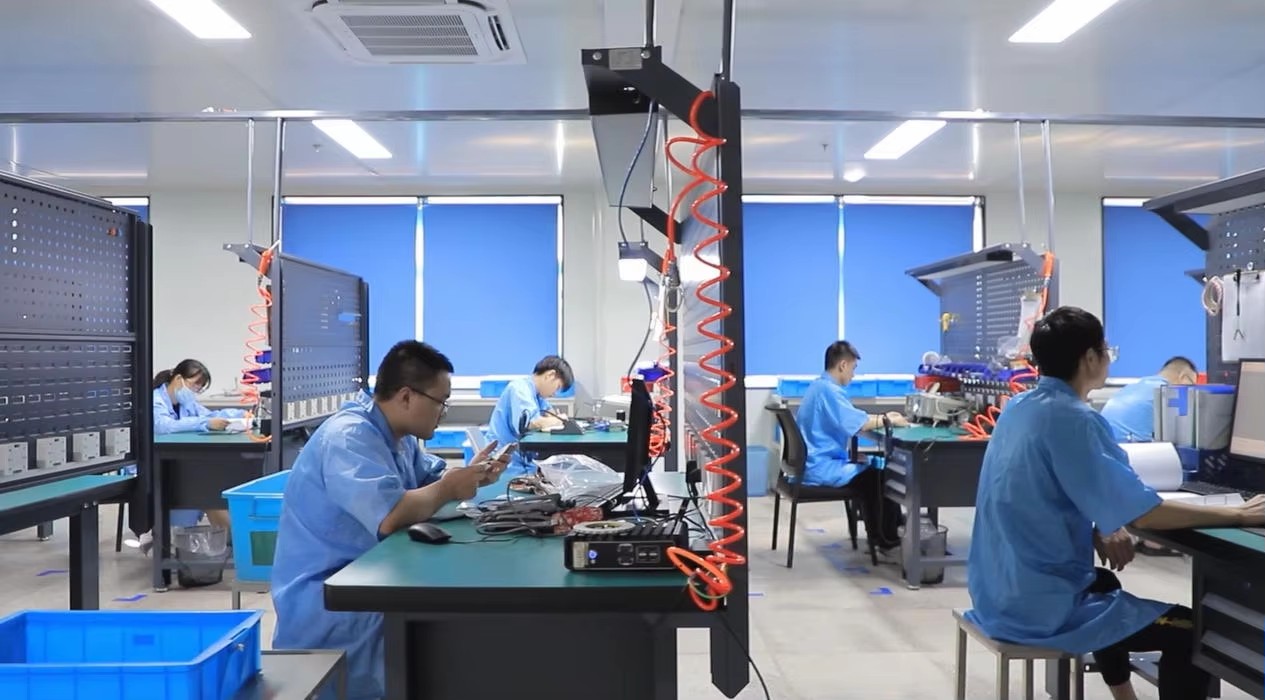
Hangzhou Aihua Instruments has been designing and manufacturing acoustic and vibration measurement instruments since 1992 — including the calibrators recommended on this page. Our sound level meters and calibrators hold National Type Approval Certificates and are CE tested, and Aihua has drafted and co-drafted national standards for sound level meters, giving us a direct hand in the requirements these instruments are built to meet.

That combination — building both the measurement instruments and the calibration references behind them, under one roof — is what lets a sensor manufacturer source a production-line reference standard from the same company whose broader instrument line already meets the standards your customers expect.

Read more
微信图片_20260423111037_53_11
6579a0f2da47543192
6579a0f34a56821986

FAQ

  • 1

    Why diagnose with airborne noise instead of just vibration sensors?

    Acoustic diagnosis works well when a component is hard to reach with a contact vibration sensor, or when the concern is the airborne noise itself rather than structural vibration. In practice, the two methods complement each other — vibration analysis is generally more sensitive to structure-borne faults, while acoustic FFT is fast, non-contact, and can cover a wider area in less time.

  • 2

    Can this replace vibration-based predictive maintenance?

    Not entirely — they're complementary tools. A well-run vibration monitoring route generally catches more developing mechanical faults with higher sensitivity, since it measures the structure directly. Acoustic FFT analysis is a strong addition where contact sensors aren't practical, or as a fast, non-contact first pass before a more detailed vibration check.

  • 3

    Do I need to know the machine's RPM before I can interpret the spectrum?

    Yes — the diagnostic frequencies for imbalance, misalignment, gear mesh and bearing defects are all calculated from the machine's actual running speed, gear ratio and bearing geometry. Without that reference information, a spectral peak is just a peak; with it, you can match the peak to a likely cause.

  • 4

    How does 24-hour monitoring help catch a developing fault?

    Some faults don't show up consistently in a five-minute spot-check — they may only appear under certain load conditions or worsen gradually over hours. Continuous logging with large onboard storage captures that full picture, rather than relying on catching the fault at the exact moment of a scheduled check.

Send Inquiry

*Name Cannot be empty!
* Enter product details such as size, color,materials etc. and other specific requirements to receive an accurate quote. Cannot be empty